Cartography & Geospatial Analysis
2022
Mapping energy communities eligible for solar tax credits under the Inflation Reduction Act of 2022
I created a collection of mapping resources to show the geographic distribution of various features that would qualify solar projects in certain regions for additional tax incentives under the Inflation Reduction Act. In both static and interactive form, they have been useful in my work at Secure Solar Futures to better understand opportunities in our regional market.
Above is an interactive map I created using ArcGIS to show various energy community criteria across statistical areas, Census tracts, and property parcels. This process involved sourcing and cleaning various publicly available data resources, compiling them in ArcGIS desktop, and transferring them into an interactive web map format in ArcGIS online. Among other qualifying factors often revolving around fossil fuel industry presence, the features in this map include proximity to closed coal mines, retired coal plants, and brownfield sites.
Click to interact with map
Click to enlarge map
In a similar vein to the above map, I created this static map in QGIS for a Department of Energy grant application to show the potential for solar project development in Appalachia, particularly in West Virginia and Virginia. It visualizes one major criterion that can make solar project eligible as an “energy community” and receive additional tax credits, which is proximity to a recently closed coal mine. Using the Mine Safety and Health Administration’s mine database, I mapped out every coal mine closed or abandoned since 2000 in the coalfield region.
United States Rail Network Map by Owner/Operator
This was a personal project I undertook after being inspired to update and improve upon a similar map from 2014. I used publicly available Department of Transportation GIS data and filtered out only the main lines from major operators. This process was a great exercise in paying close attention to detail and using symbology very intentionally to keep lines clearly distinguishable from one another. Additionally, it required the careful layering of basemap elements to provide enough contrast in the topography while not overpowering the main features of the map.
Click the map to enlarge it. A full quality, finer scaled version can be downloaded here.
2021
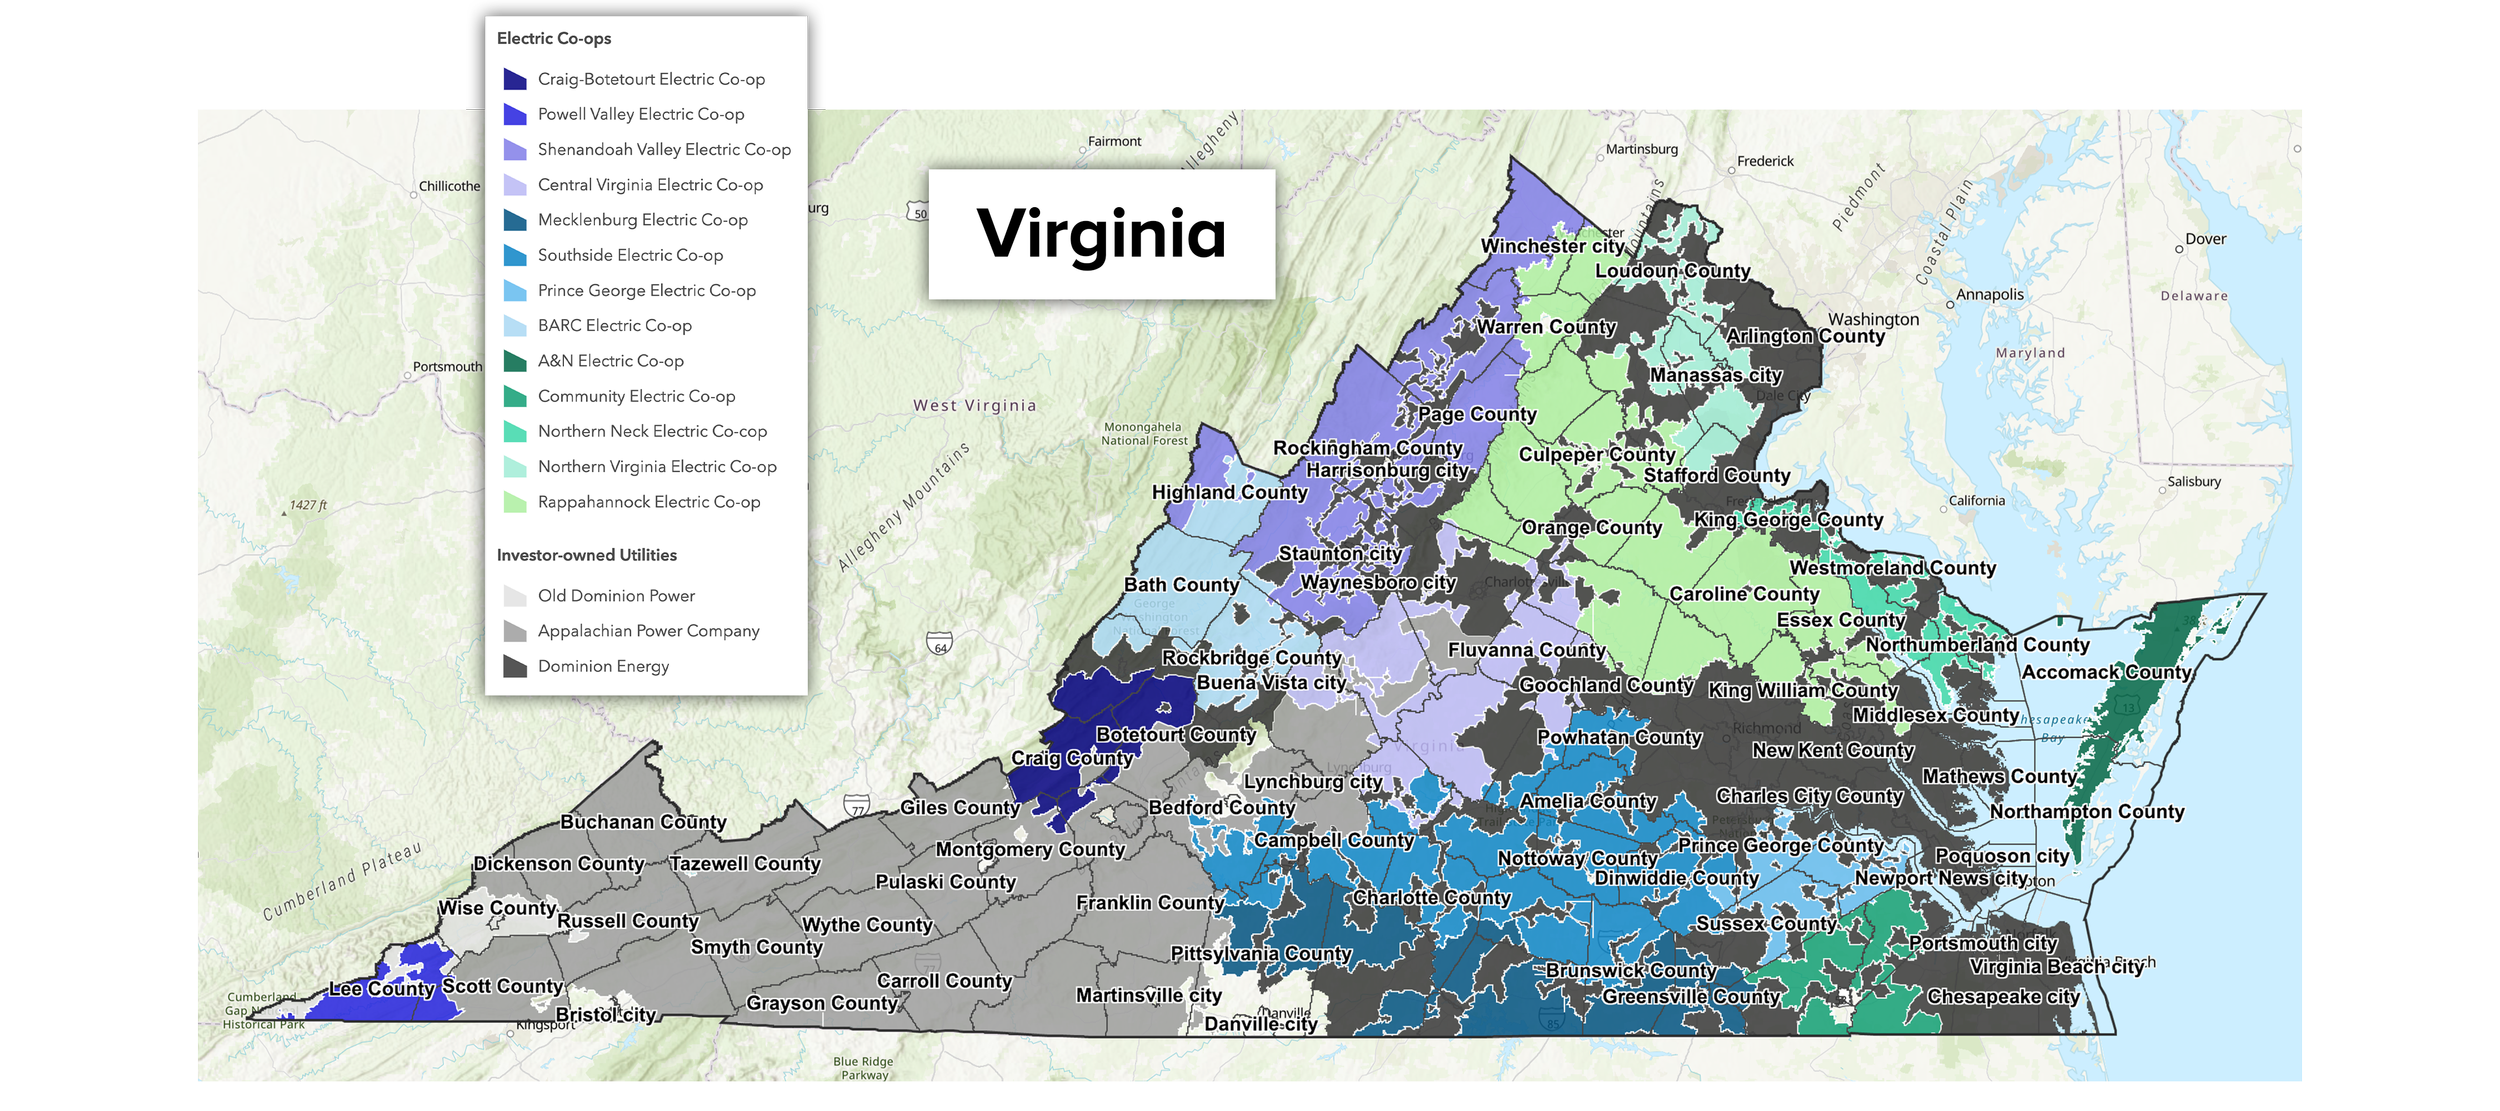
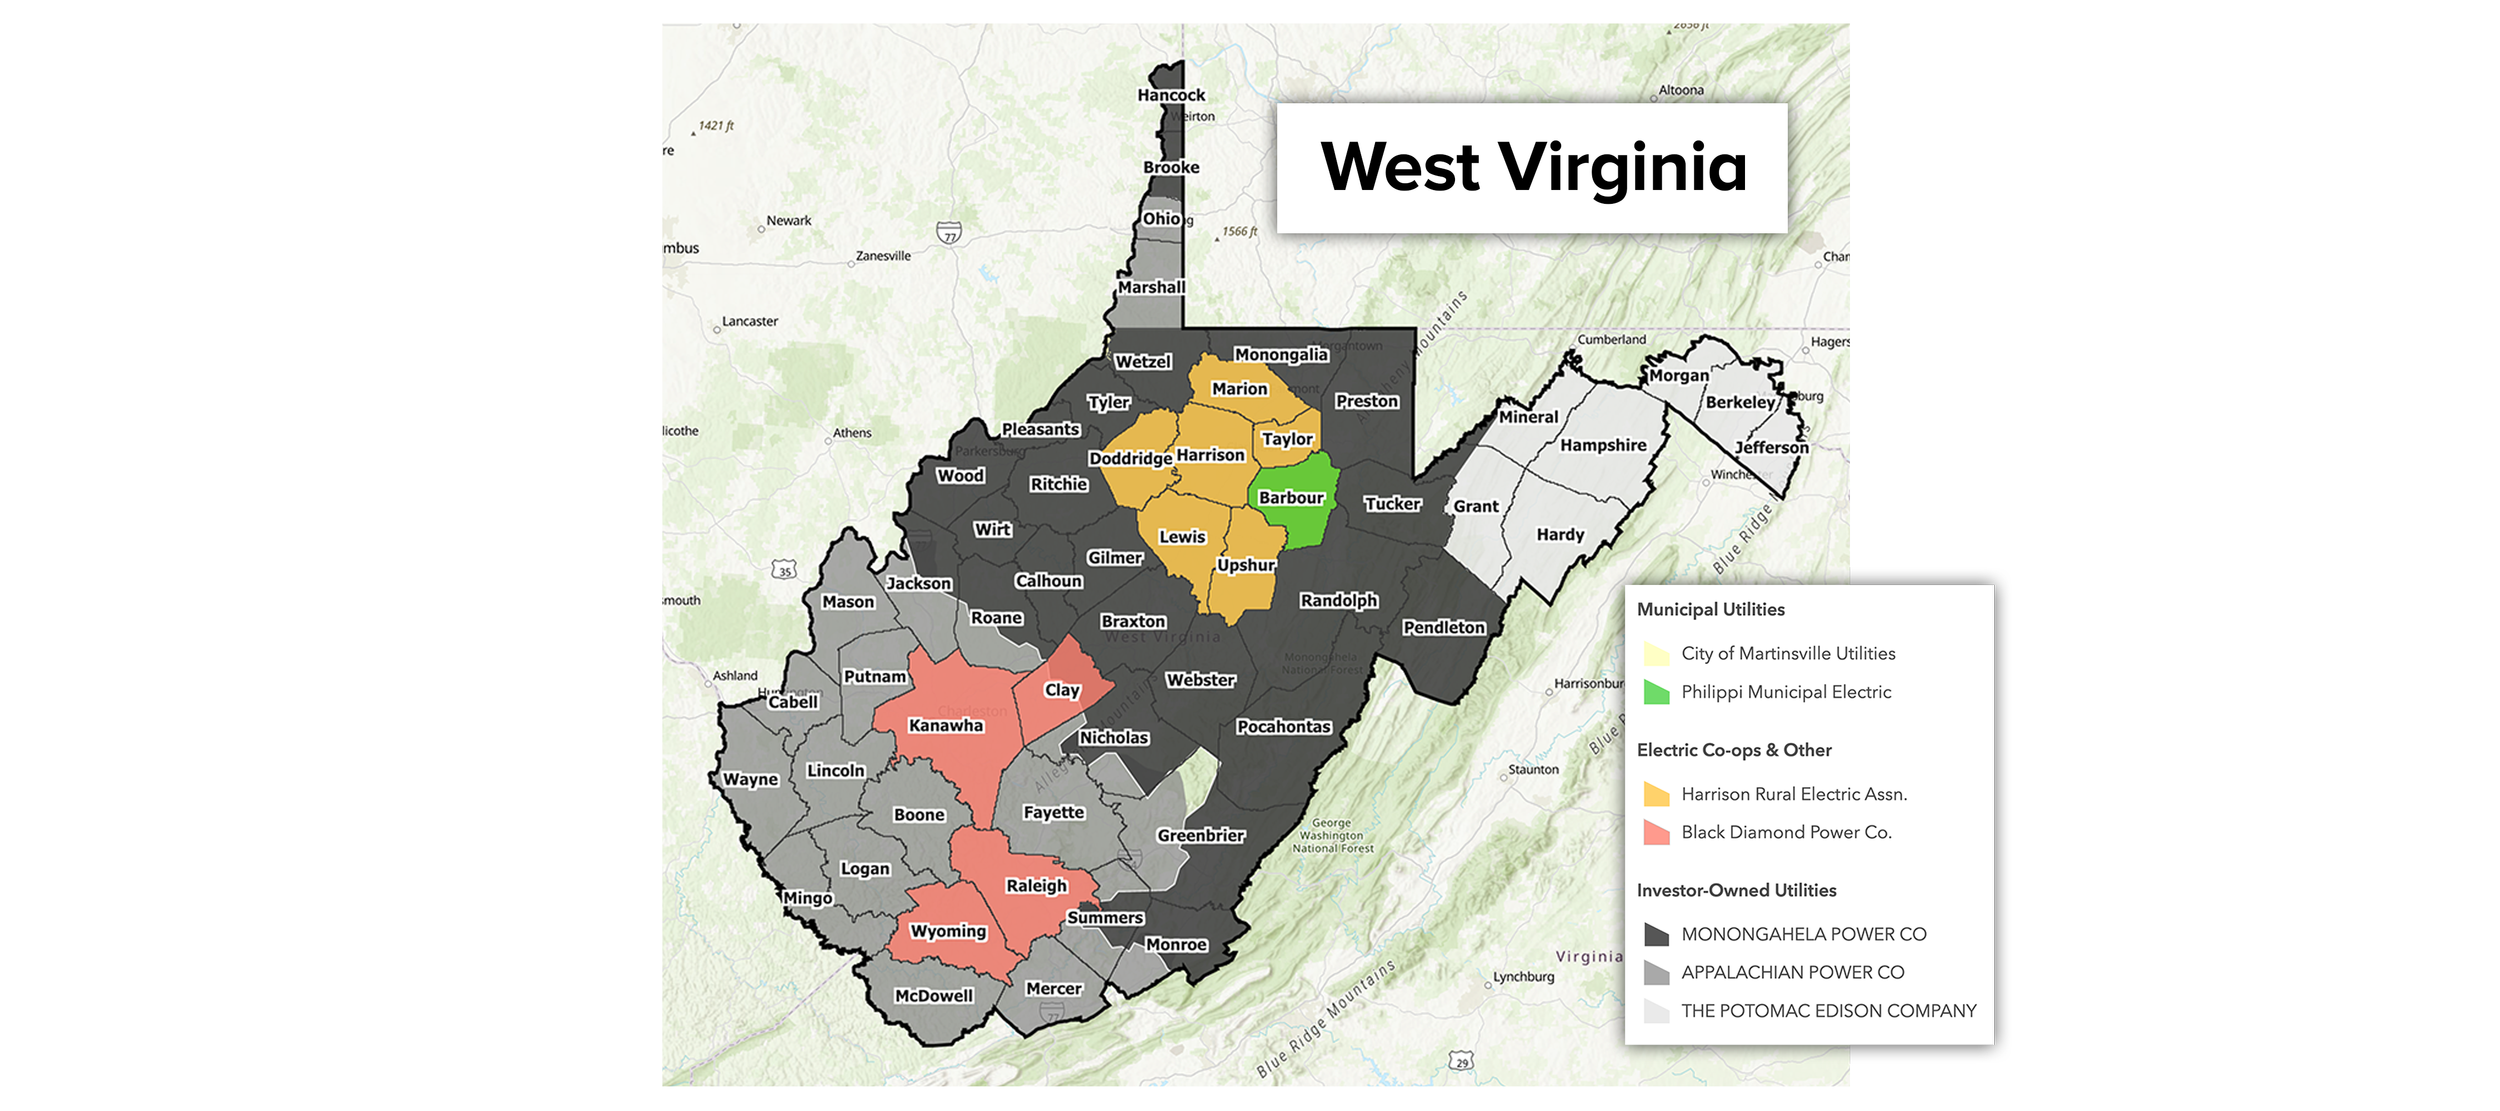
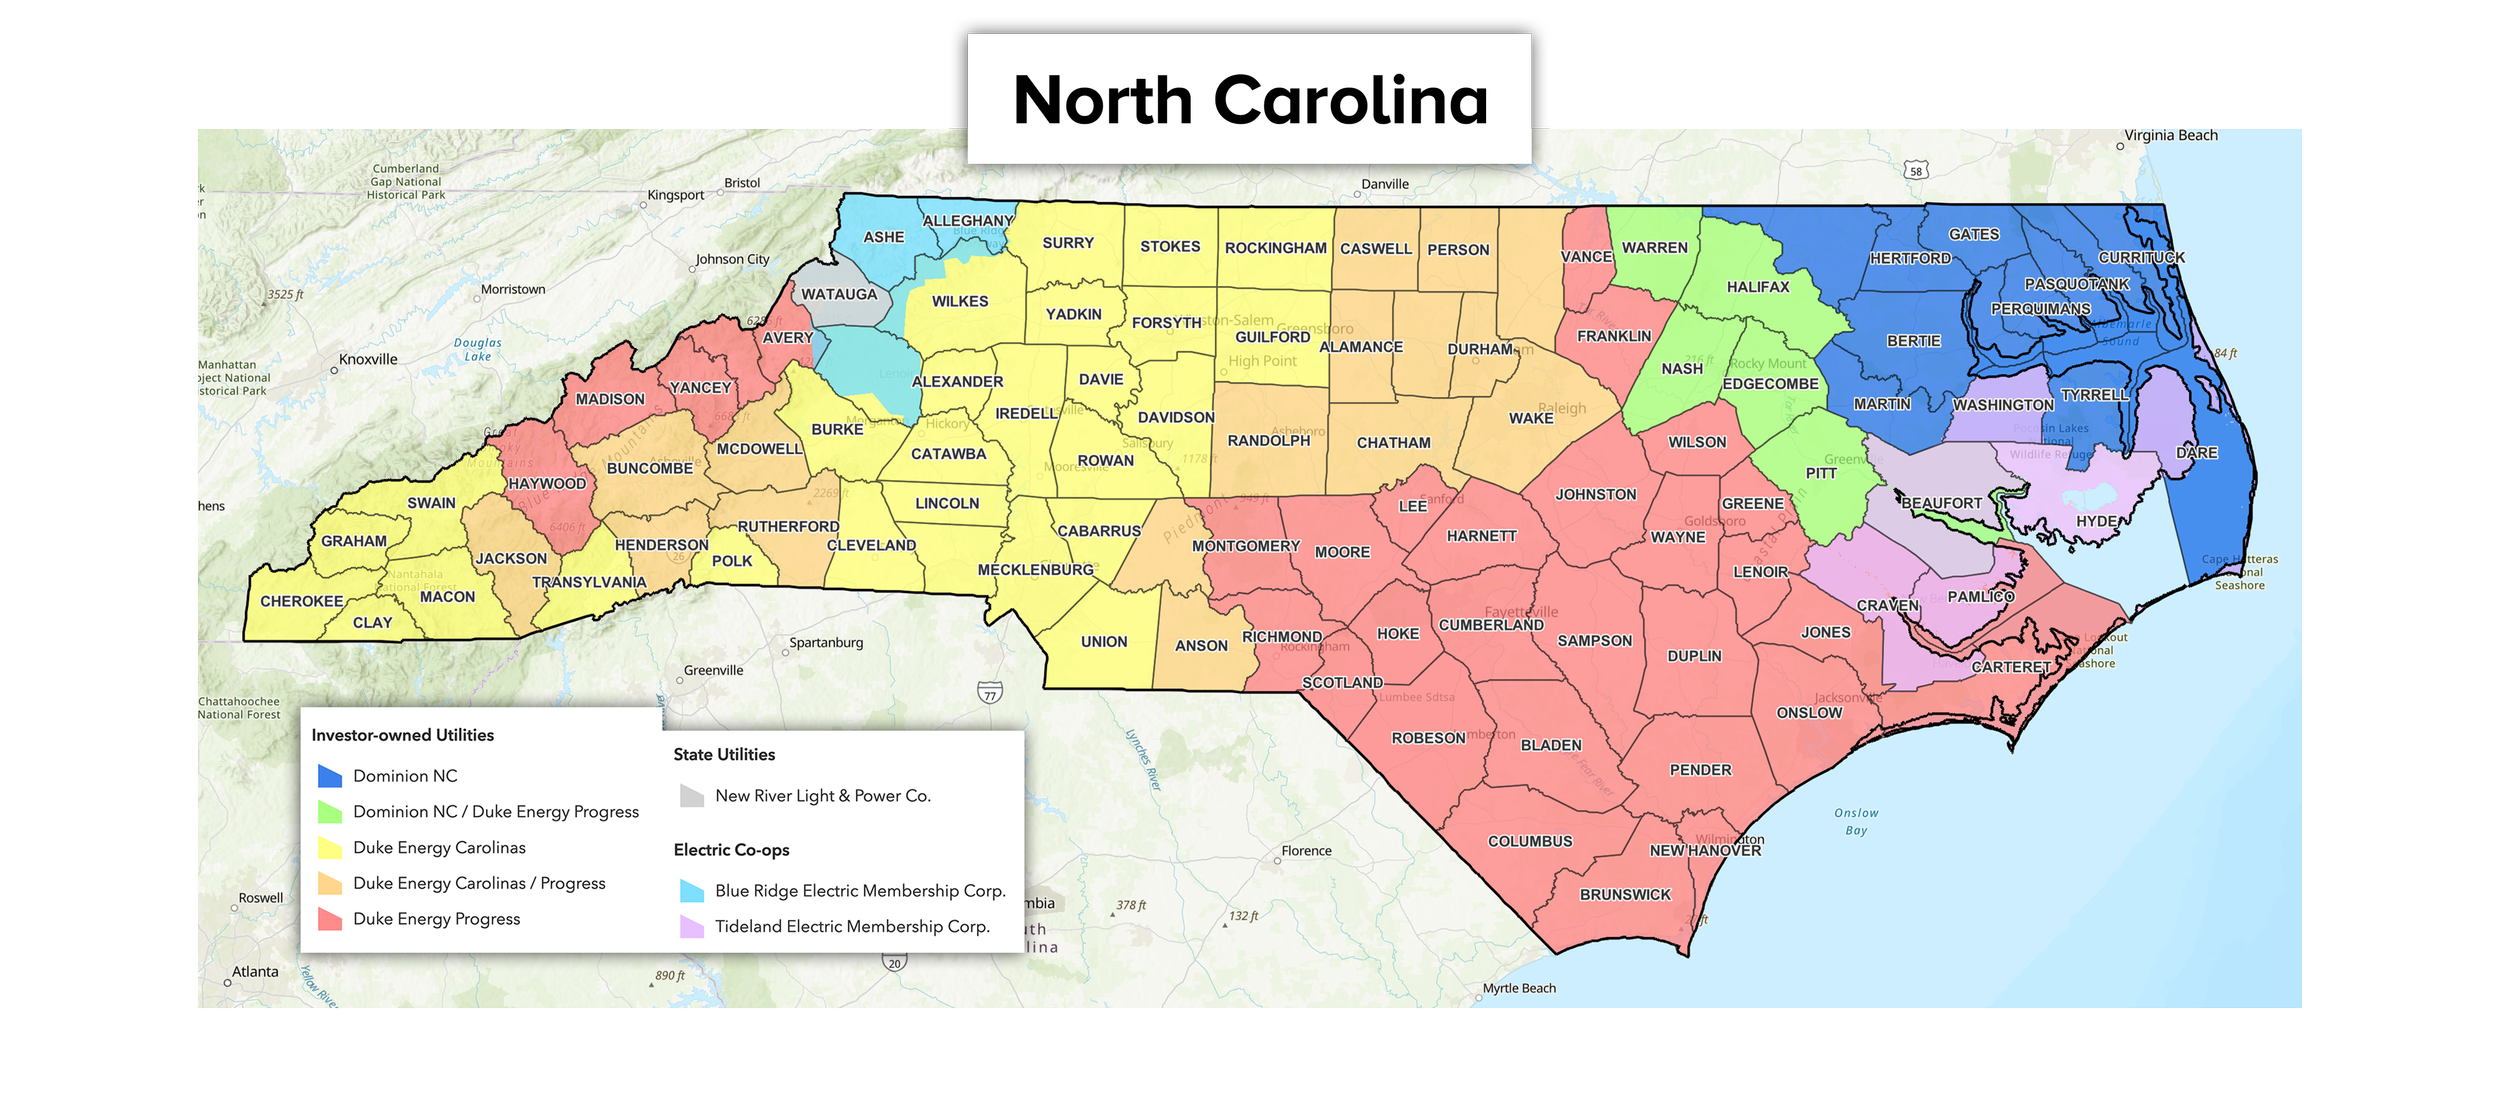
Regional energy market maps
I developed the first iteration of these maps to better understand the energy market in Virginia, which has been the first and most central market for Secure Solar Futures’ project development. I have since created maps for West Virginia, North Carolina, and South Carolina as shown below. I used state and federal GIS data on electric utility services areas to better inform our team about varying conditions and regulatory environments in each area. I created interactive versions of these maps for internal use by our team, which have more granular data on various commercial facilities and market potential.
Mapping solar regulatory environments
I designed this figure in QGIS for a solar project proposal with Pittsylvania County Schools in Virginia. Along with Augusta and Orange counties, with whom we have completed projects previously, each map shows electric utilities and the structures for solar financing permitted by each.
Click to enlarge map
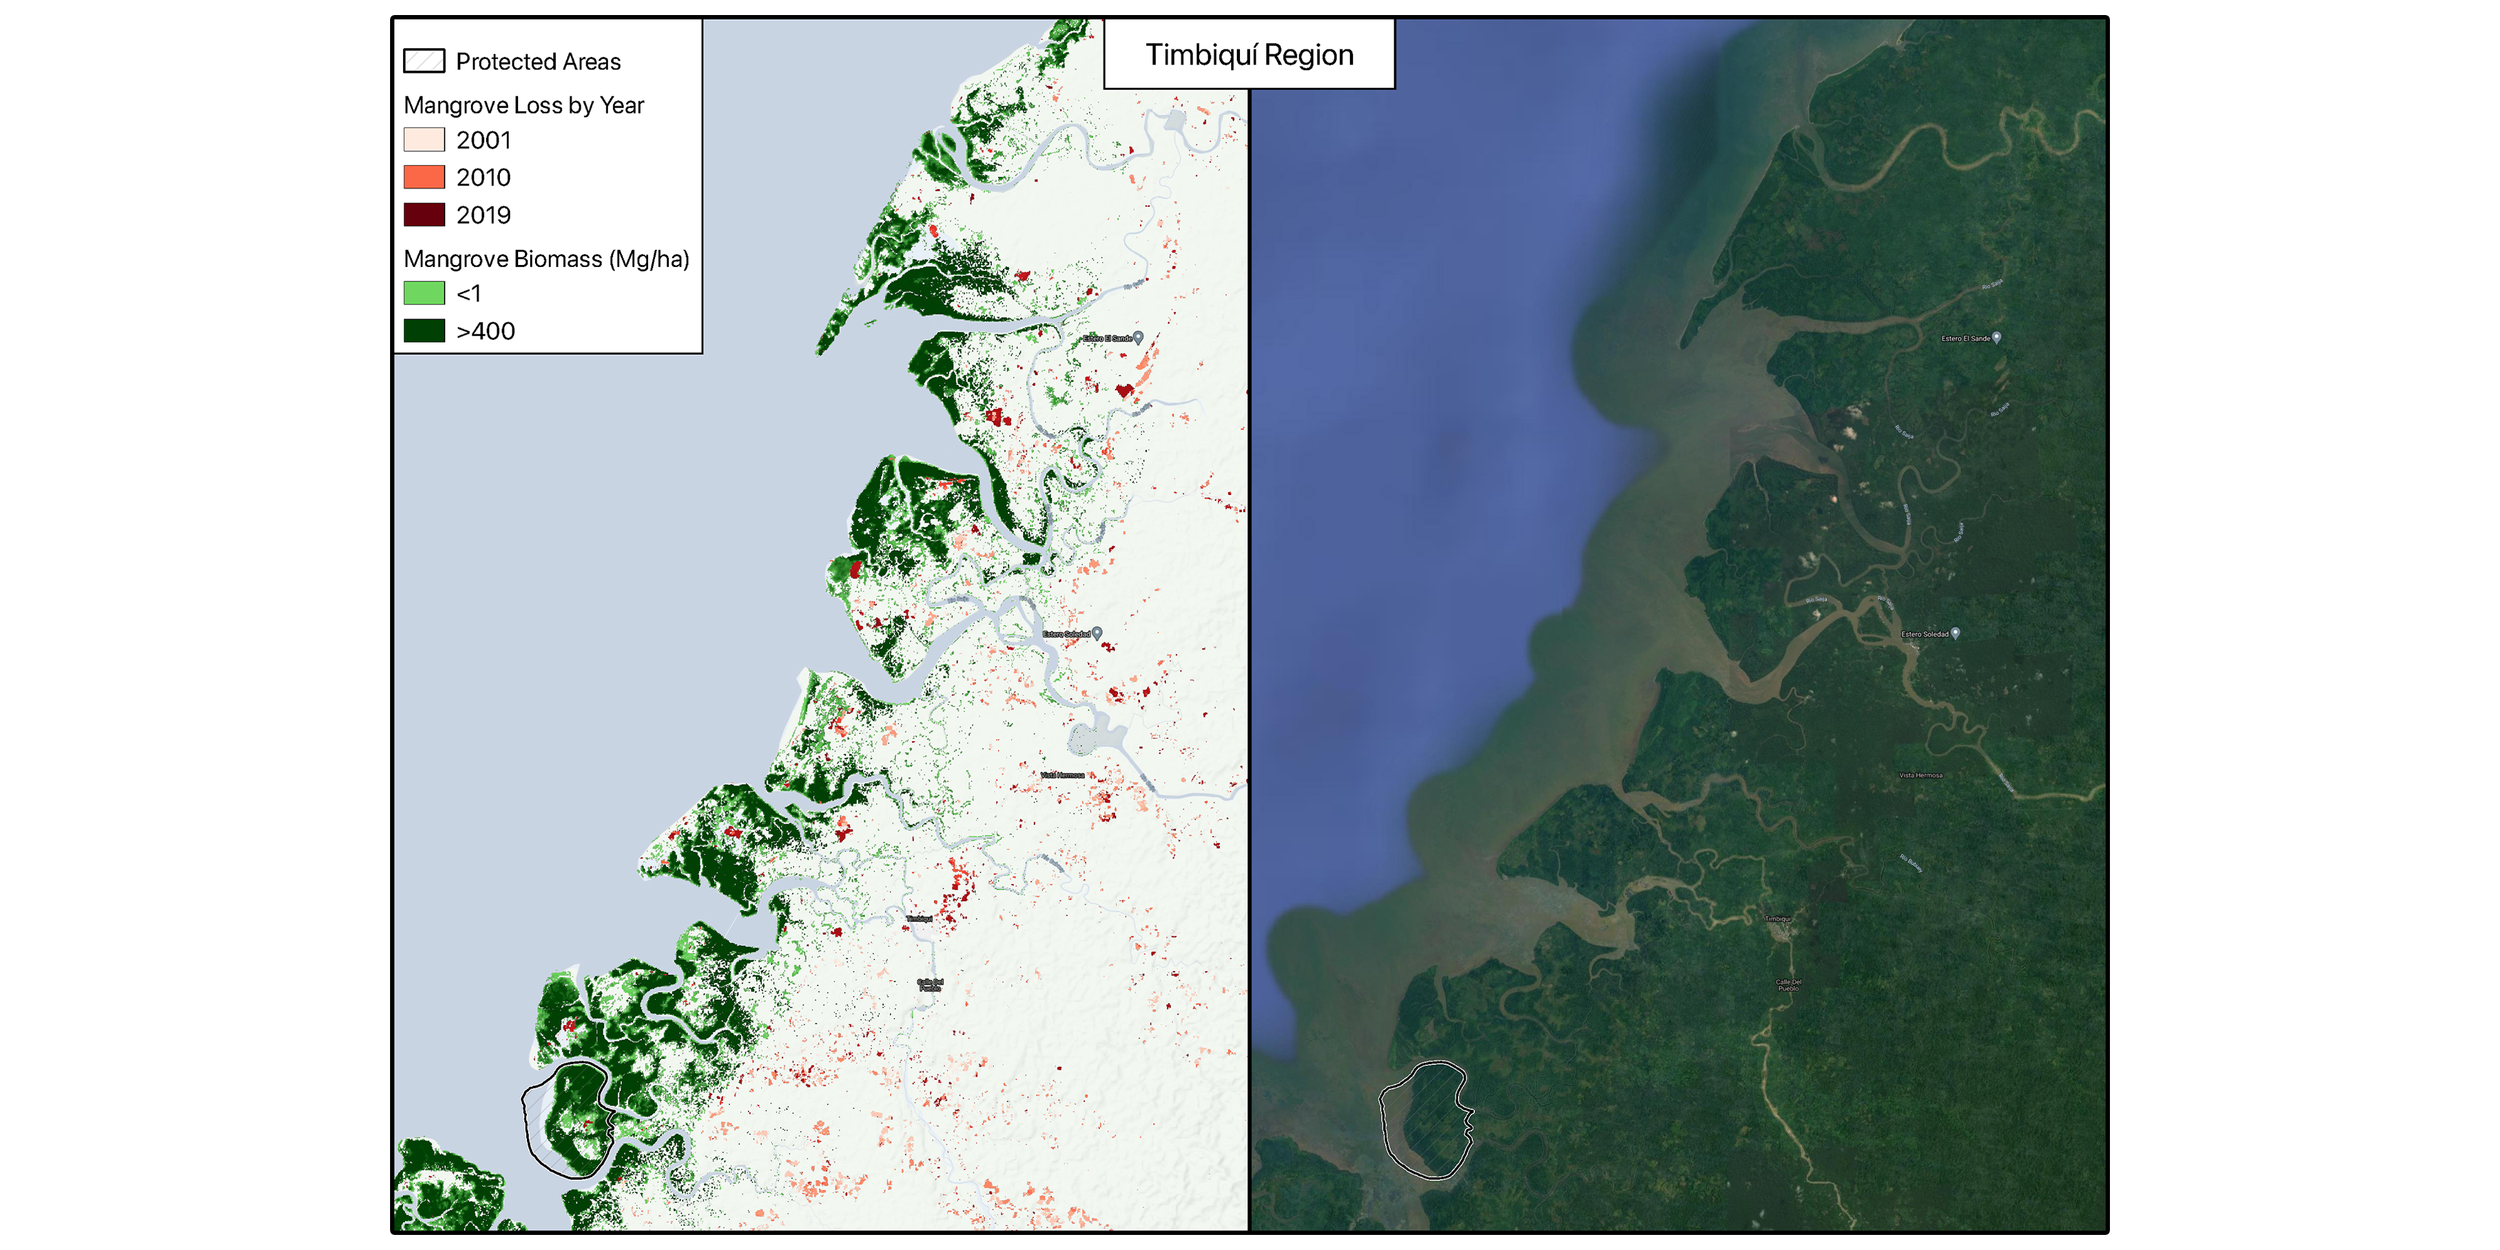
Analyzing prospective conservation areas along Colombia’s Pacific coast
The maps below were part of a grant proposal for a prospective project to inventory mangrove loss along certain stretches of Colombia’s Pacific coast and determine effective conservation strategies. Upon assembling the maps, I also conducted a raster analysis on the layers of mangrove biomass density per hectare to determine carbon sequestration capacity, total biomass, and habitat loss over time in certain protected and unprotected areas along the coast.
The proposal was based on a review article I wrote for a Global Sustainability class at UR discussing the compounding stressors of habitat loss and climate change in the region. The article was published as part of this report and as an ArcGIS StoryMap.
2020
These maps, which I compiled in ArcGIS, visualize the central results from my December 2020 publication Assessing Inequitable Urban Heat Islands and Air Pollution Disparities with Low-Cost Sensors in Richmond, Virginia. This article, which I lead authored, was the outcome of my undergraduate research at the University of Richmond.
The top two maps show mean temperature (a) and particulate matter concentrations (b) from sensors deployed around the city, categorized by significant difference (more details on this analysis under Data Analysis & Visualization). The bottom left map (c) shows the full network of installed sensors at the time of publication, as well as priority areas for further monitoring. The underlying vulnerability index was developed by partners at the Science Museum of Virginia as an aggregation of stressors such as lack of green space, extreme heat, and poverty by census block.
Selected maps from my December 2020 Sustainability article on urban environmental justice disparities in Richmond
a) Mean temperature by sensor
b) Mean particulate (PM2.5) matter by sensor
c) Full sensor network as of publication
d) Major air pollution sources
Click to enlarge maps
I used the bottom right map (d) as a foundation for this project to better understand what to expect in terms of the air quality landscape throughout the city. Using ArcGIS, I assembled data on emissions sources and layers with major road arteries from state and federal agencies to estimate vulnerability of different communities in Richmond to air pollution.
Habitat suitability mapping for a college GIS class project
Click to enlarge map
I made the above map for an open-ended assignment in a GIS class at UR. Interested in exploring an urban ecologyrelated topic, I assembled data on land cover, green space, and habitat suitability in ArcGIS. This is a favorite map of mine, as I think it showcases a creative use of symbology to outline multiple complex and highly heterogeneous components of an urban landscape.


